What a Plate’s Modes Tell Us About Its Wood

By Michele Ducceschi, Sebastian Duran, Henna Tahvanainen, and Ludovico Ausiello
A spruce soundboard and a piece of structural timber may look similar, yet sound entirely different when tapped. The difference lies in the wood’s elastic properties. Quantifying those properties precisely has always been a challenge.
Within NEMUS project a method was developed to do that: recover the elastic constants of a rectangular wooden plate accurately, non-destructively, and without requiring a specific set of edge boundary conditions.
Why Elastic Constants Matter
Wood is an orthotropic material, meaning it has different mechanical properties along different axes — along the grain, across the grain, and through the thickness. These directional differences are characterised by a set of elastic constants: Young’s moduli (resistance to stretching), shear moduli (resistance to twisting), and Poisson’s ratios (how much the material contracts sideways when stretched lengthwise). Together, they govern how a plate deforms and vibrates under mechanical excitation.
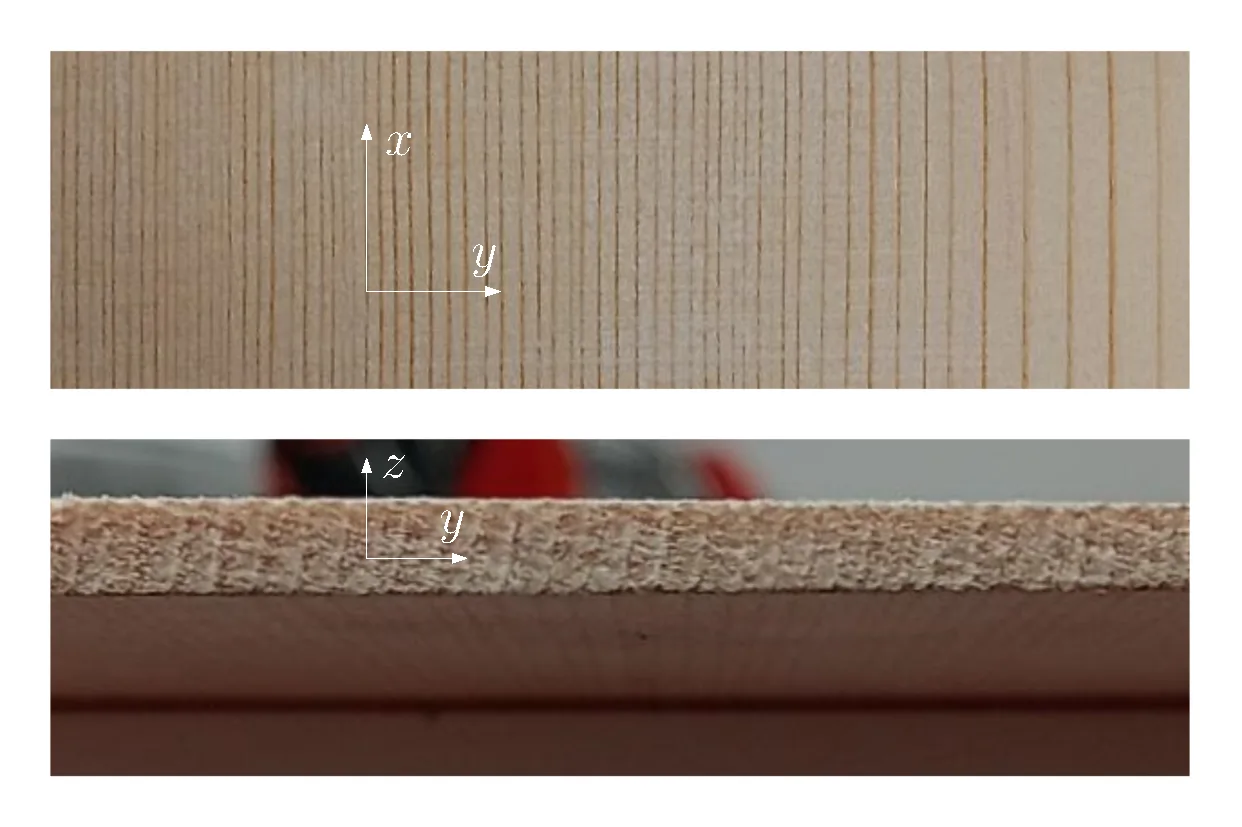
Fig. 1. Quarter-sawn spruce: the top view shows the grain running along the longitudinal direction; the cross-section reveals the radial direction. These two axes, together with the tangential direction through the thickness, define the orthotropic character of the material.
For musical instrument makers and researchers, knowing these constants precisely is crucial. They determine the plate’s modal behaviour — its natural frequencies, mode shapes, and damping — which together govern the sound the instrument produces. In the context of NEMUS — which aims to create physics-based digital restorations of historical instruments — accurate plate characterisation is a foundational step. You cannot simulate an instrument faithfully if you do not know the mechanical properties of its wood.
The difficulty is that wood is notoriously variable. No two pieces are alike, even from the same tree. Elastic constants shift with moisture content, temperature, and cutting technique. Measuring them through destructive testing — applying forces large enough to permanently deform or fracture the sample — is obviously unacceptable for precious or historical material. What is needed is a method that is non-invasive, repeatable, and accurate.
The Key Insight: Resonance Frequencies Are Linear in the Elastic Constants
The method exploits a mathematically elegant property of thin orthotropic plates: the squared resonance frequencies depend linearly on the elastic constants. This follows directly from the Kirchhoff plate equation, when the plate geometry is held fixed.
What this means in practice is that, once you know the shape of a vibration mode — specifically, the pattern of nodal lines on the plate’s surface — you can write down a simple linear equation relating that mode’s measured resonance frequency to the unknown elastic constants. Collect measurements from enough distinct modes, and you have an overdetermined system of linear equations — more equations than unknowns — which can be solved in a least-squares sense via straightforward matrix inversion. This sidesteps the need for iterative nonlinear solvers, which can be slow and may converge to spurious solutions.
The coefficients in those equations — which quantify how sensitive each resonance frequency is to each elastic constant — are pre-computed numerically from a set of simulated plates sharing the same edge conditions and aspect ratio as the plate under study. The experimentally measured frequencies are then matched against this numerical basis to recover the elastic constants.
Chladni Patterns: A Classical Tool for Mode Identification
To apply the method, one must identify which resonance mode corresponds to each measured frequency. This is where a centuries-old experimental technique finds fresh purpose.
Ernst Chladni, the 18th-century German physicist, showed that scattering fine sand on a vibrating plate causes it to accumulate along the nodal lines, where zero transverse displacement occurs. The resulting geometric figures, now called Chladni patterns, are a direct visual representation of the mode shape.
In this method, Chladni patterns are used to assign each measured resonance frequency to the correct set of precomputed modal coefficients. The procedure is fast and visually intuitive: the user drives the plate sinusoidally at each resonance frequency, photographs the resulting sand pattern, and matches it against the numerically computed mode shapes. The only equipment required is a loudspeaker or electromechanical transducer, a signal generator, and a camera.
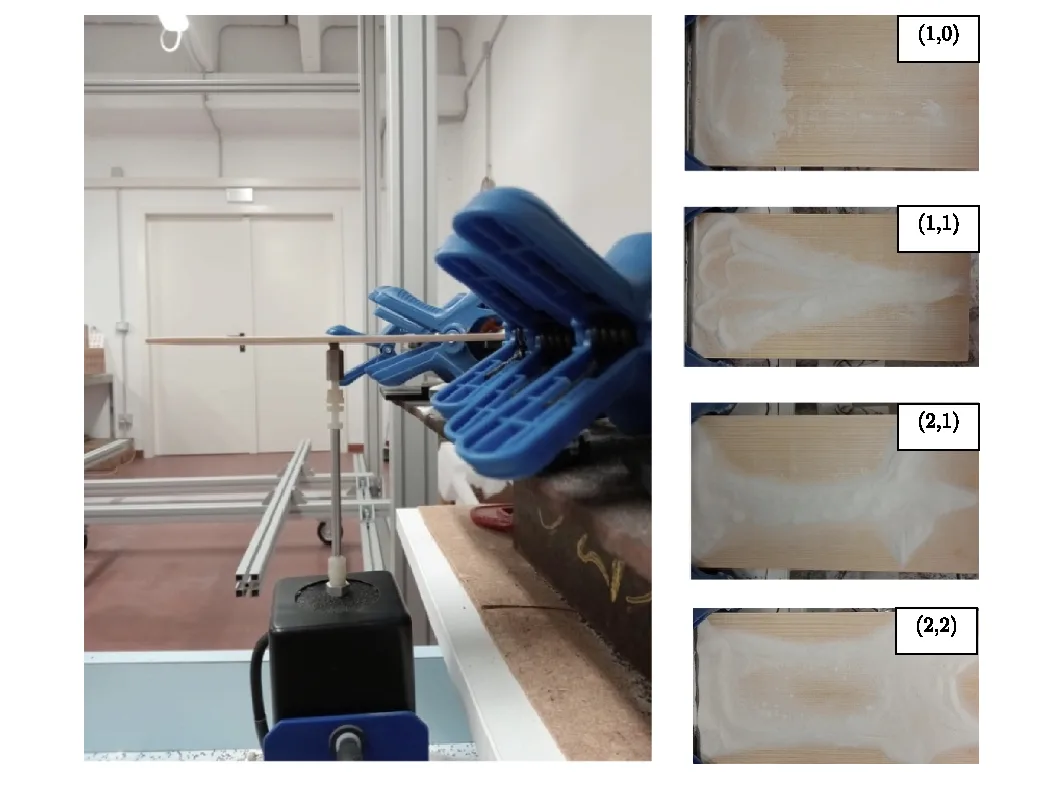
Fig. 2. Experimental setup for the Finnish spruce tonewood plate under cantilever boundary conditions (left), and the corresponding Chladni patterns for four of the six identified modes (right). Sand accumulates along the nodal lines, providing a direct visual map of each mode shape.
Any Edge Conditions, Multiple Independent Estimates
A significant practical advantage of this approach over earlier methods — such as the widely used techniques by McIntyre & Woodhouse and Caldersmith & Freeman — is that it places no restriction on the edge boundary conditions. Earlier methods assumed a freely suspended plate and depended on measuring three specific modes. This approach is valid whether the plate edges are free, clamped, simply supported, or any combination thereof.
This flexibility matters in practice. A clamped or cantilever mounting (fixed along one edge, free along the others) is often easier to realise consistently in a workshop setting than a truly free suspension. The method was validated experimentally on both a cantilever Finnish spruce plate and a clamped red spruce plate, yielding consistent and physically plausible elastic constants in both cases.
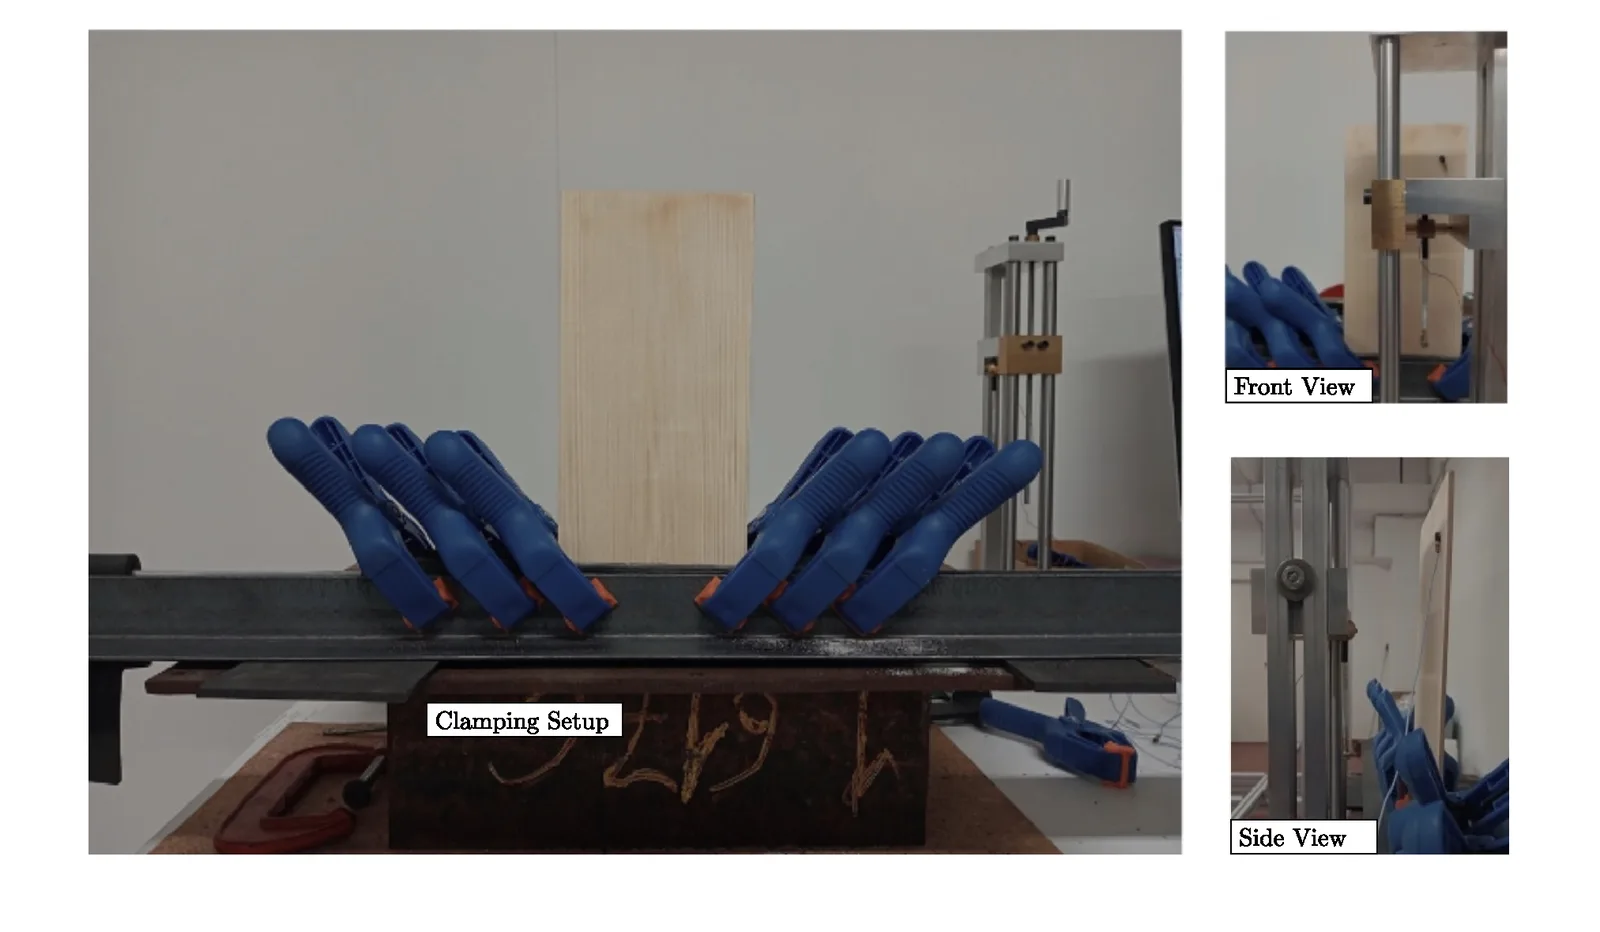
Fig. 3. Clamping setup for the Finnish spruce tonewood plate. Two iron angular elements are held together with spring clamps; a rubber layer protects the specimen surface. The pendulum-mounted impact hammer is visible in the background.
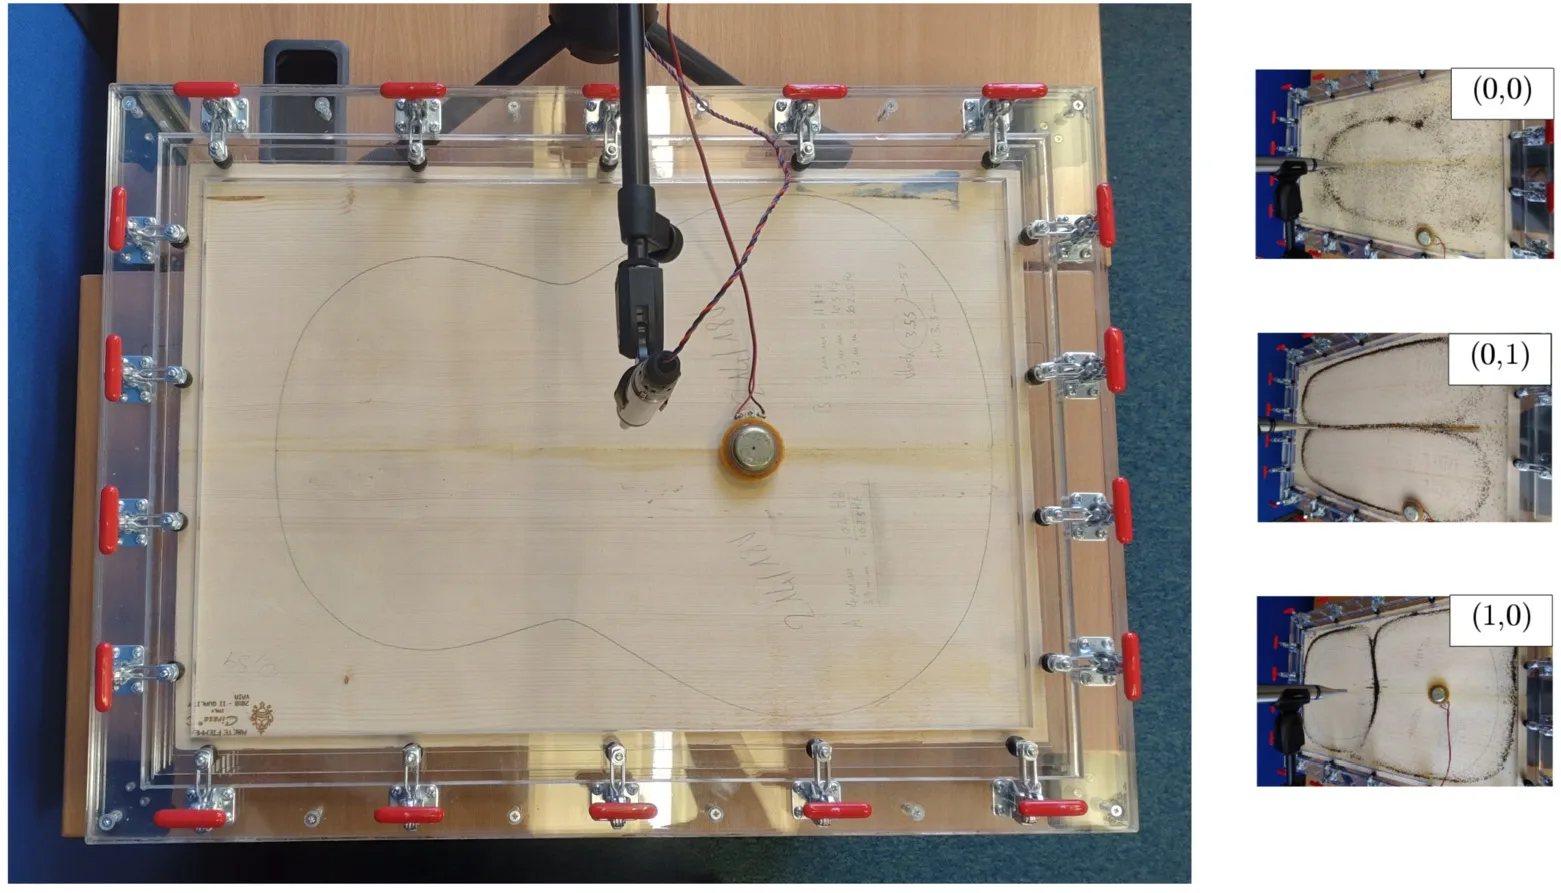
Fig. 4. Experimental setup for the Fiemme Valley red spruce guitar top, clamped in a plexiglass frame along all four edges (left), and Chladni patterns for three of the six identified modes (right). Dried tea leaves were used as the tracer material in this case.
A further benefit comes from the overdetermined nature of the system. Measuring just six resonance modes yields 42 independent estimates of each elastic constant — one for every possible pair of modes used in the inversion. This redundancy supports rigorous statistical analysis: the variance across estimates quantifies measurement consistency and provides a natural uncertainty bound on each recovered constant.
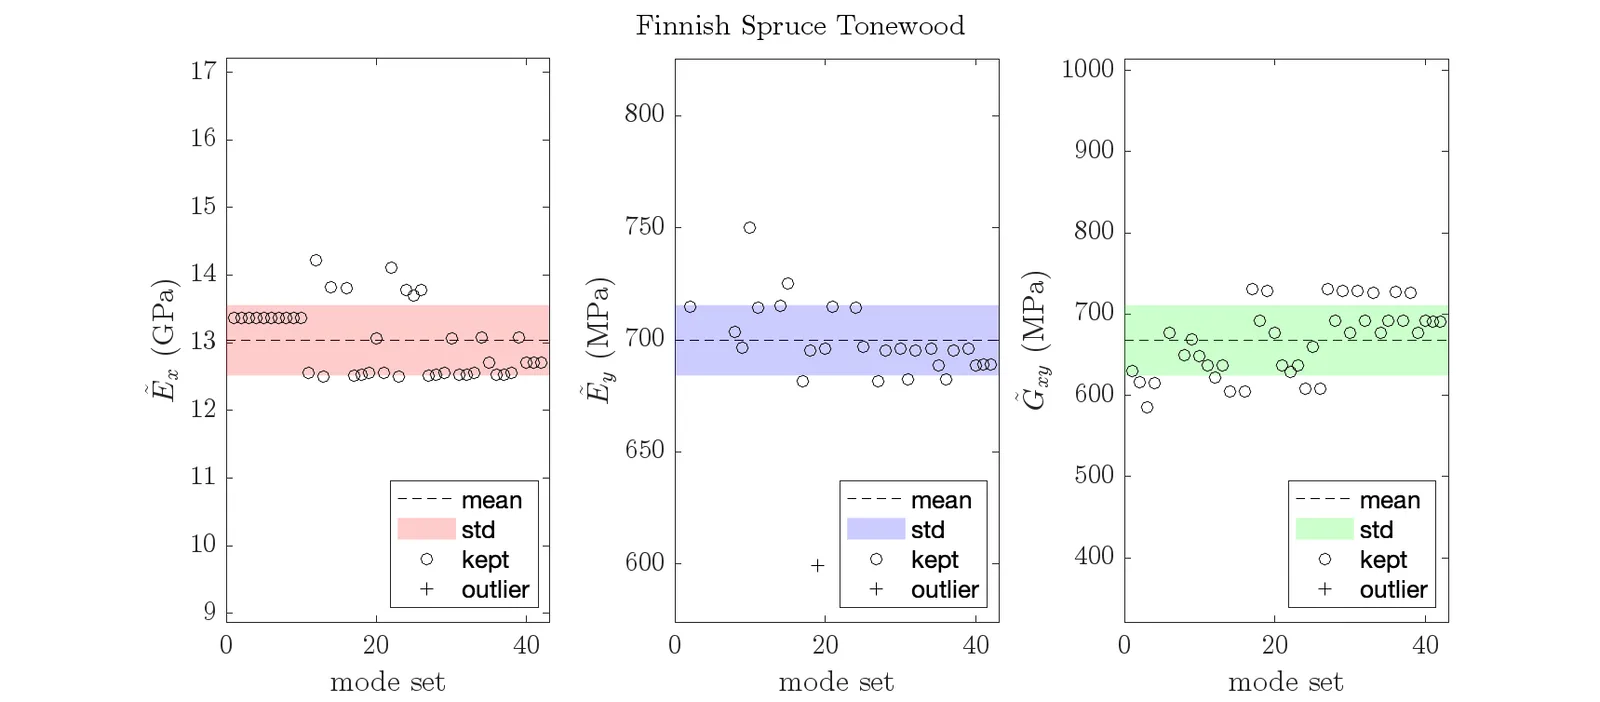
Fig. 5. The 42 independent estimates of the three elastic constants for the Finnish spruce tonewood, obtained from all possible mode combinations. The dashed line and coloured band indicate the mean and standard deviation; outliers are marked with a cross.
A Physical Interpretation: Decoupled Mode Combinations
Beyond its practical advantages, the linear least-squares framework yields a conceptually illuminating result. By performing an eigendecomposition of the coefficient matrix, one can construct specific linear combinations of the original resonance modes in which each elastic constant is completely decoupled from the others — each combined mode shape is sensitive to exactly one elastic constant.
Rather than thinking of each individual resonance as jointly encoding all of the plate’s stiffness properties, this decomposition reveals natural axes in mode space that isolate each property independently. Beyond clarifying the mathematical structure, this picture has potential implications for understanding how specific constructional choices in instrument making — plate thickness, graduation, bracing geometry — selectively tune individual stiffness parameters.
What This Means for NEMUS
Within the NEMUS project, where the goal is the physical modelling and digital restoration of historical string instruments, this work provides a rigorous and practical tool for characterising the vibroacoustic properties of instrument soundboards. Whether applied to a freshly prepared test plate or a carefully handled historical board, the ability to recover reliable elastic constants non-destructively — with quantified uncertainty — brings physics-based modelling of real instruments a step closer.
The paper includes detailed numerical benchmark tests and two experimental case studies. It is published open-access in Applied Acoustics and a preprint is freely available on arXiv (2311.06935).
Michele Ducceschi, Sebastian Duran, and Henna Tahvanainen are at the Department of Industrial Engineering, University of Bologna. Ludovico Ausiello is at SENE, University of Portsmouth. This work was supported by the European Research Council under the NEMUS project (ERC grant 950084).