Thick or Thin Plates: When Thin-Plate Theory Breaks Down for Musical Instruments Soundboards
By Sebastian Duran, Henna Tahvanainen, and Michele Ducceschi
Plate theory is at the heart of how we model the vibrations of musical instrument soundboards. But plate theory comes in more than one flavour, and the choice matters. The simplest and most widely used model — Kirchhoff-Love, or thin-plate theory — assumes that the plate is thin enough that shear deformation and rotational inertia through the thickness can be safely neglected. While this is a common assumption for musical instruments soundboards, it may not always be that reliable.
A paper recently submitted for publication by NEMUS introduces a systematic framework for checking exactly this: given a set of modes, does the data conform to thin-plate theory, or has the plate crossed into a regime where a thicker model is needed?
Why the Choice of Model Matters
When estimating the elastic constants of a wooden plate from its resonance frequencies — as in the Chladni-based method described in our previous post — the inversion is built on the Kirchhoff-Love plate equation. If the plate is thin enough, this works well. If it is not, the model will return systematically wrong elastic constants, even with perfect measurements.
Existing criteria for deciding whether a plate qualifies as “thin” are based on the dispersion relation of an unbounded plate — essentially asking at what frequency the simple thin-plate wave speed starts to deviate from the more complete Mindlin-Reissner prediction. But a dispersion relation assumes infinite extent. Real soundboards are finite, with boundary conditions that determine which wavenumbers actually appear in the mode sequence. The frequencies at which thick-plate effects show up in the modes can be very different — and in practice much lower — than what dispersion-based cutoff arguments would suggest.
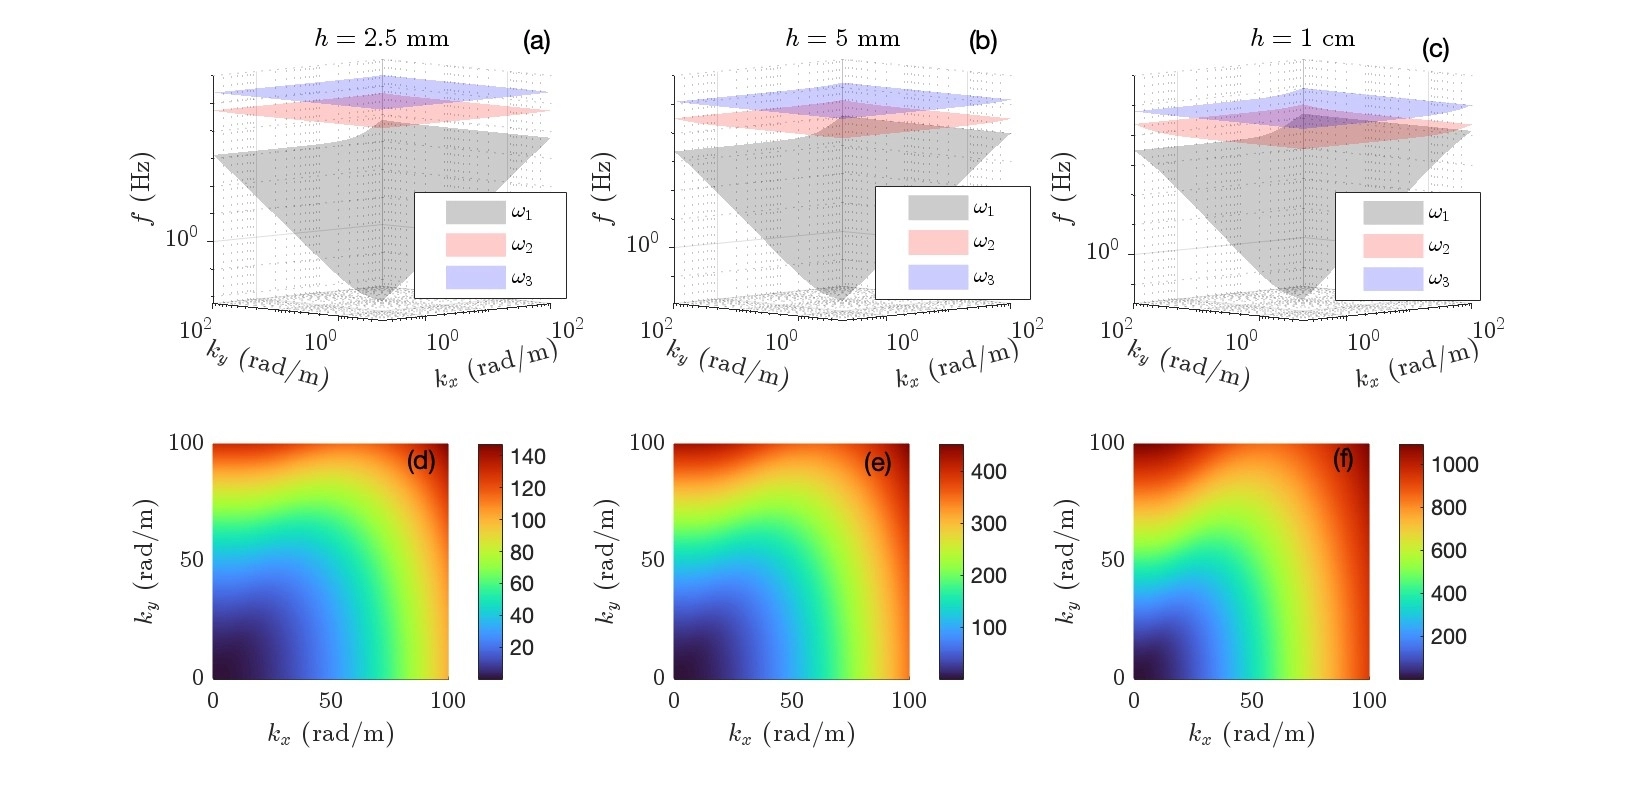 Fig. 1. The three branches of the Mindlin-Reissner dispersion relation at h = 2.5, 5, and 10 mm (top row), and the cent deviation between Mindlin-Reissner and Kirchhoff-Love in the wavenumber plane (bottom row). Deviations grow rapidly with thickness and with wavenumber — but these plots assume an unbounded plate and do not directly predict when modes of a finite plate will be affected.
Three Families of Plates, Across Geometries and Thicknesses
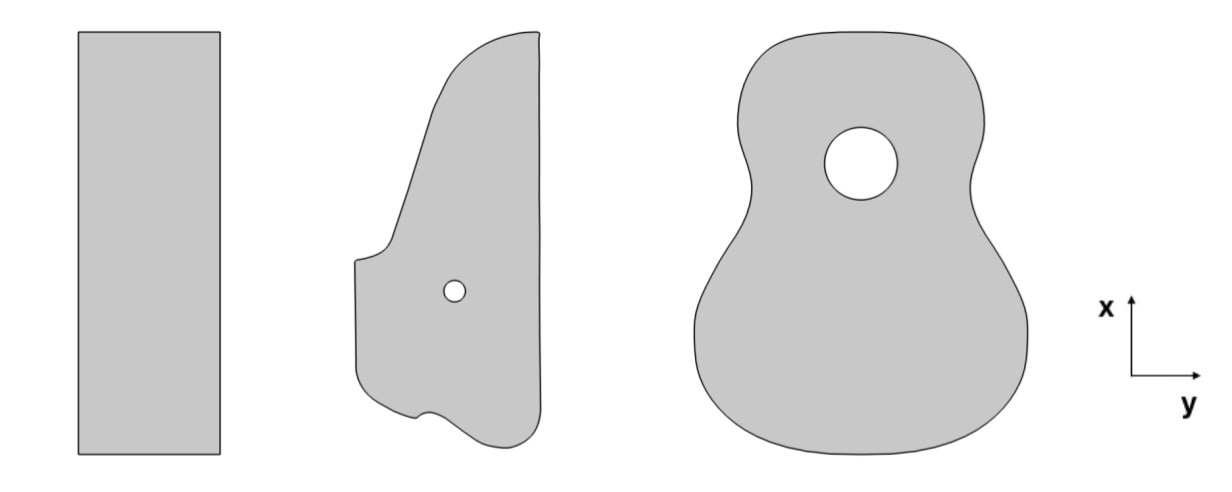
The study considers three plate geometries: a rectangle with aspect ratio 3:1 (representative of a book-matched soundboard blank), and shapes based on a classical guitar top and a concert kantele top. For each geometry, three surface areas are tested, and thicknesses range from 0.5 mm all the way up to 30 mm — well beyond anything used in real instruments, but useful for understanding where the model breaks down.
Fig. 2. The three plate geometries studied: a rectangular plate (left), a kantele soundboard (centre), and a guitar top plate (right). All simulations use fully clamped boundary conditions and spruce elastic constants.
The simulations use COMSOL’s Plate module, which is based on the Mindlin-Reissner model — the more complete theory that includes shear and rotational inertia. At very small thicknesses, the two models agree closely, and the Mindlin-Reissner results define a thin-plate baseline: the reference set of mode shapes and non-dimensional frequencies that the plate would have if it were truly thin. As thickness increases, deviations from this baseline are tracked mode by mode.
Non-Dimensional Frequencies Reveal the Onset of Thick-Plate Behaviour
A key step in the framework is working in non-dimensional form. By rescaling frequencies and spatial coordinates using the plate’s surface area and the shear rigidity constant, plates of different sizes but the same geometry, material properties, and boundary conditions collapse onto a single universal modal sequence in the thin-plate regime. This means that deviations from the thin-plate baseline reflect only the effect of thickness — not size.
The deviation of each mode’s non-dimensional frequency from its thin-plate reference is expressed in cents (the same unit used in musical tuning: 100 cents = one semitone). This makes the results immediately interpretable: a deviation of 50 cents, for instance, would be clearly audible and would introduce a comparable error into any elastic constant estimated from that mode.
Modal Crossings
As thickness increases, the order of the modes can change — a phenomenon called modal crossing. A mode that was the third in the sequence at low thickness may become the second at higher thickness, because a different mode drops below it in frequency as shear effects shift the resonance structure.
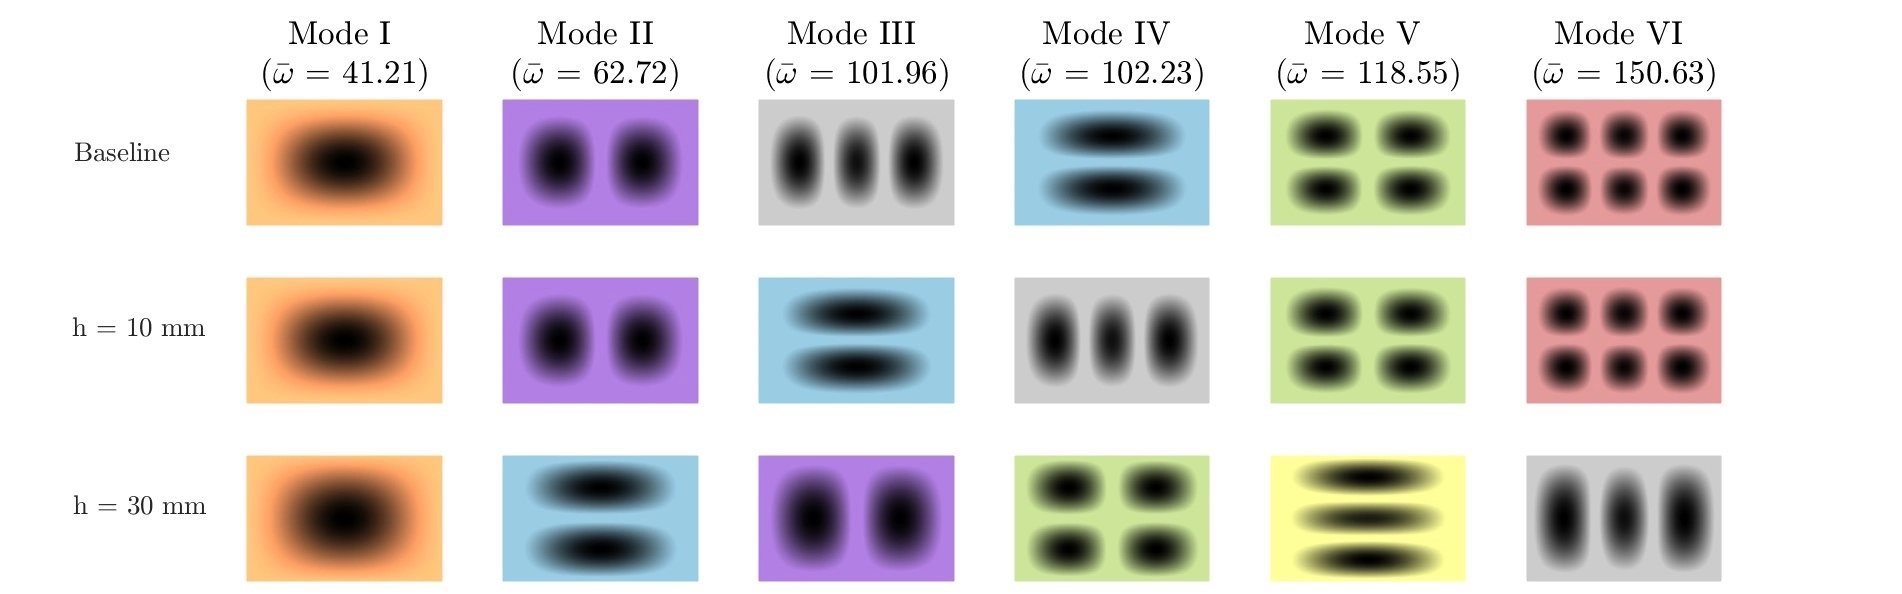 Fig. 3. The first six mode shapes of the rectangular plate at the thin-plate baseline (top row), at h = 10 mm (middle), and h = 30 mm (bottom). The colour coding tracks each mode’s identity: note how modes III and IV swap order between the baseline and h = 10 mm, and how the sequence is significantly rearranged by h = 30 mm.
For guitar-shaped plates, modal crossings and distortions appear at lower absolute thicknesses than for rectangular plates of comparable area, reflecting the more complex geometry.
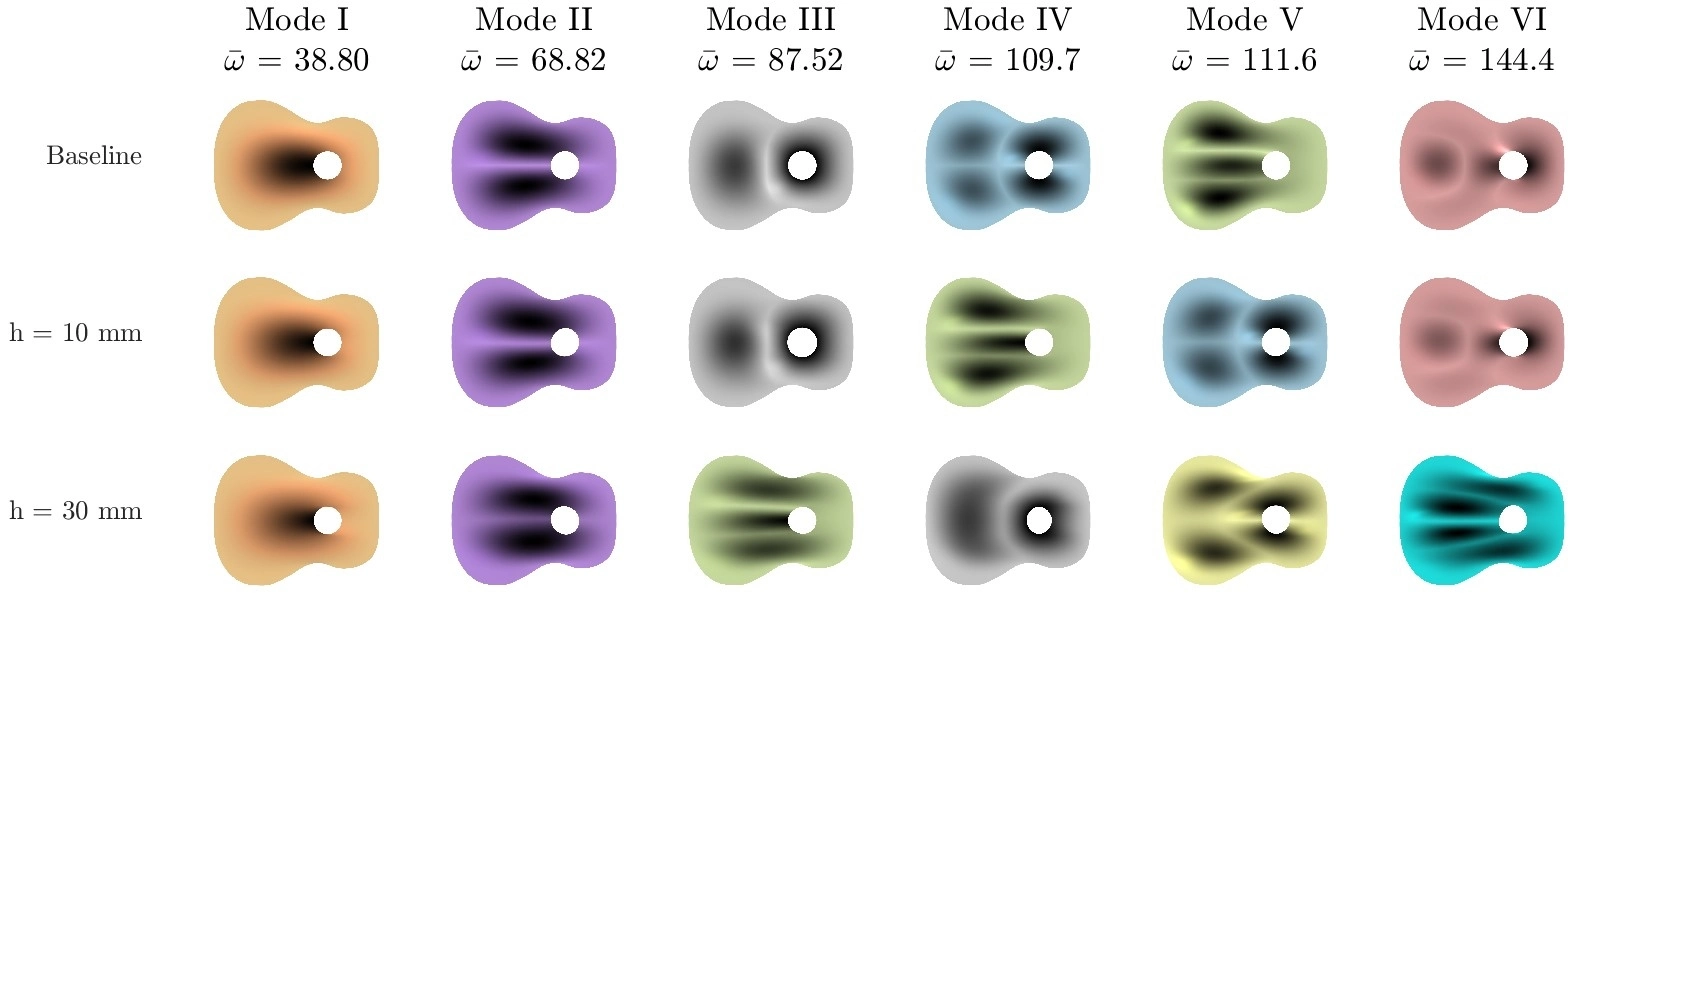 Fig. 4. The first six mode shapes of the guitar top plate (Plate 2, A = 0.13 m²) at baseline, h = 10 mm, and h = 30 mm. Modal crossing between modes IV and V is already visible at h = 10 mm; by h = 30 mm the sequence is substantially reorganised.
A Non-Dimensional Scaling Law
Beyond identifying when crossings occur, the work establishes a quantitative scaling law. The frequency deviation of each mode from its thin-plate reference follows a power law in thickness, and — more usefully — when the data from plates of different sizes within the same family are plotted against the non-dimensional parameter ι = √A / h (the ratio of the plate’s typical linear dimension to its thickness), they collapse onto a single curve per mode.
This is the central practical result: ι is a single diagnostic number. For a given plate geometry and boundary conditions, there is a threshold value of ι (approximately 40 across all geometries studied) below which thin-plate theory begins to fail in the modal domain. For ι above this threshold, frequency deviations follow a clean power law; below it, they deviate from the power law and thick-plate effects dominate.
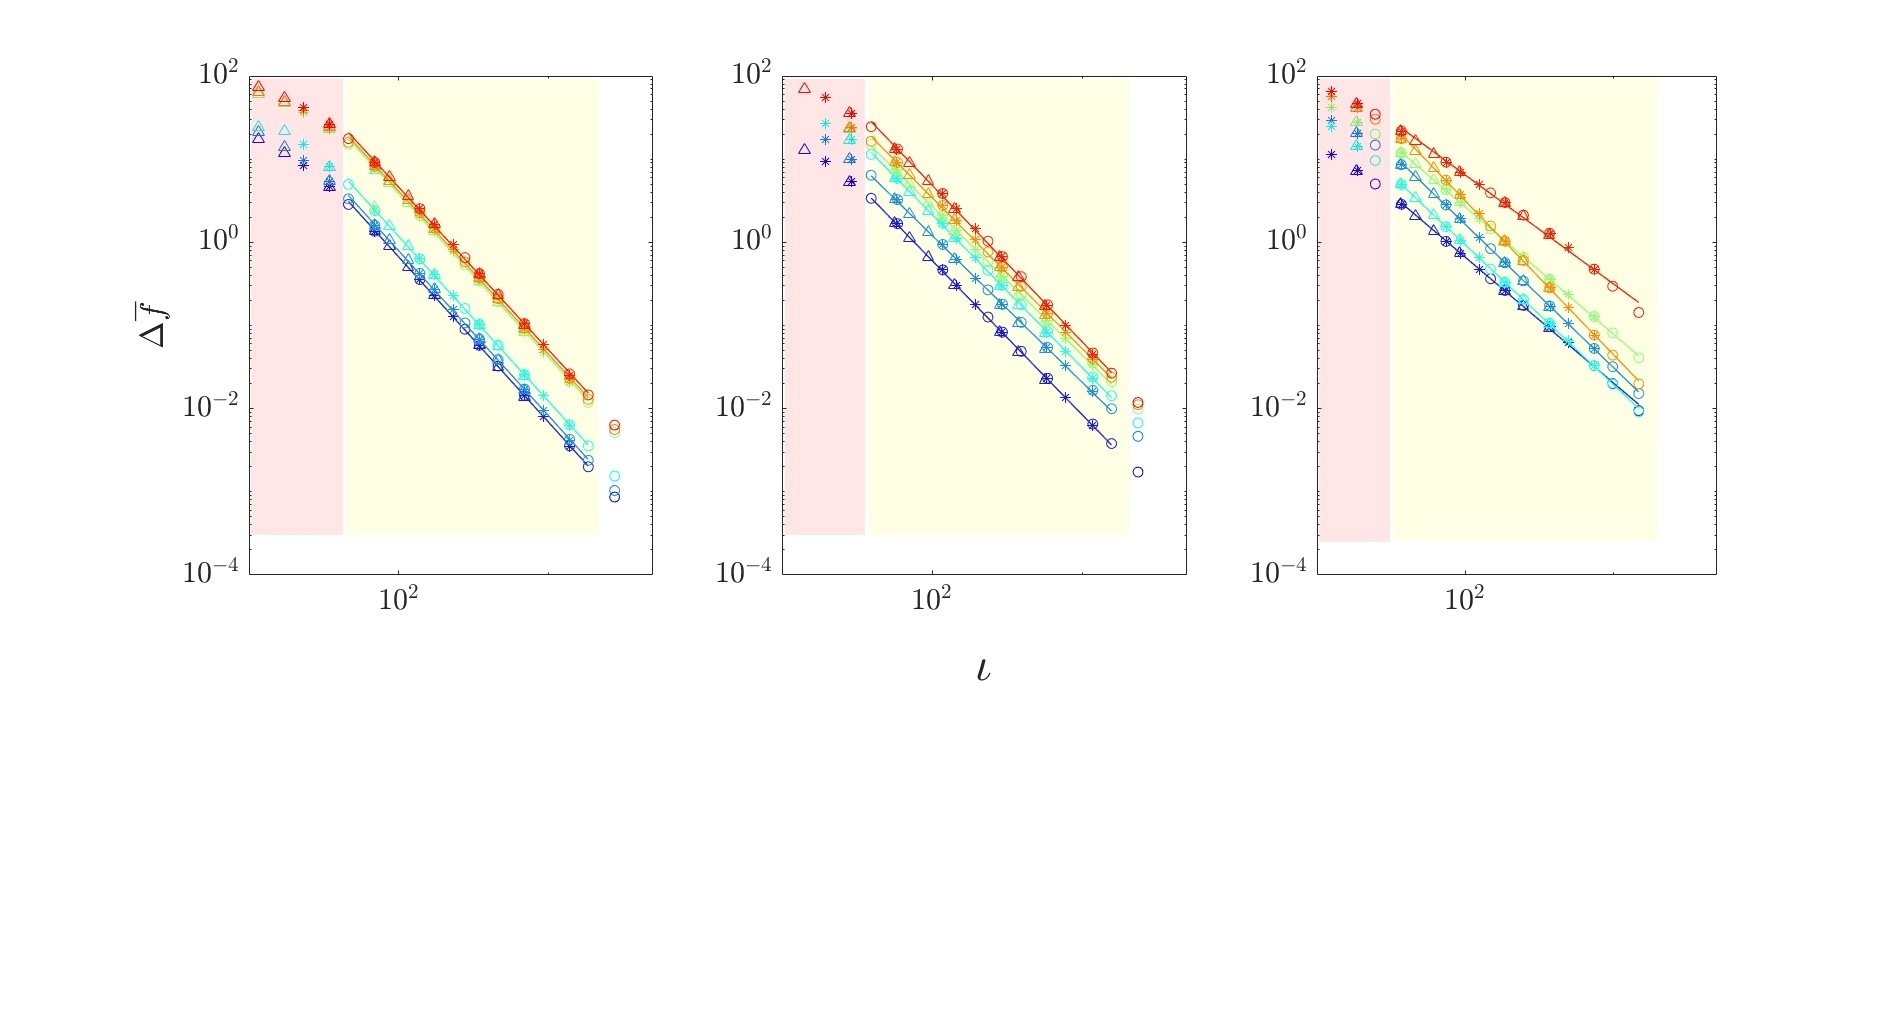 Fig. 5. Dimensionless frequency deviations Δf̄ as a function of ι for all three plate families (left to right: rectangular, kantele, guitar). In the yellow region (ι > ~40), deviations align along straight lines — well described by the power law. In the red region (ι < ~40), deviations curve away from the power law, marking the onset of thick-plate behaviour.
Consequences for Inverse Elastic constants estimation: A Case Study
The practical implications are demonstrated with a case study on a kantele soundboard. Using the least-squares Chladni-based inversion method from the companion paper, elastic constants are estimated from FEM-generated “experimental” frequencies at a range of thicknesses. The ground-truth elastic constants are known, so the error in the recovered values can be measured directly.
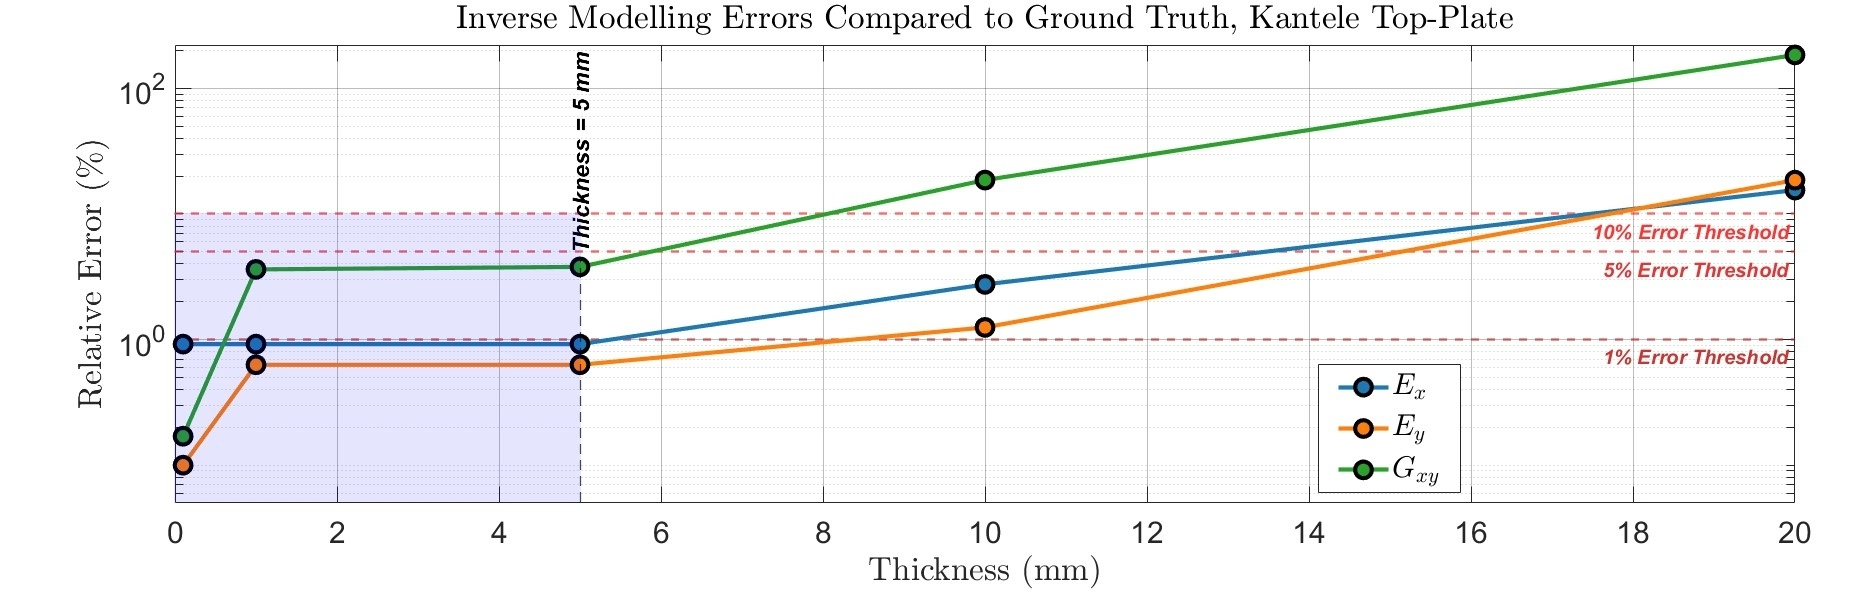 Fig. 6. Relative error in the estimated elastic constants (Ex, Ey, Gxy) for a kantele top plate as a function of thickness. Estimation errors remain below 5% up to h = 5 mm (ι ≈ 117). Beyond this, errors grow rapidly — exceeding 20% at h = 20 mm — as thick-plate effects increasingly corrupt the thin-plate inversion.
The result is clear: for plates with ι above roughly 40, thin-plate inverse methods remain reliable. Below this threshold, the errors grow rapidly and the recovered elastic constants can no longer be trusted. For concert kantele soundboards, which can reach 5 mm in thickness, the method sits at the edge of its validity range. For smaller or thicker plates — including some piano soundboards — the framework identifies that thin-plate assumptions should not be used without verification.
What This Means for NEMUS
This work provides the NEMUS project with a principled tool for assessing whether a given plate measurement is suitable for thin-plate inversion — a prerequisite for the reliable physical modelling of historical instruments. Rather than relying on rules of thumb or conservative cutoff criteria, researchers and instrument makers can now compute ι directly and consult the diagnostic curves to assess whether their mode data falls in the thin or thick regime.
The preprint is available through the corresponding authors. It was supported by the European Research Council under the NEMUS project (ERC grant 950084).
Sebastian Duran, Henna Tahvanainen, and Michele Ducceschi are at the Department of Industrial Engineering, University of Bologna.